
Developing a Thriving Ecosystem for Data Visualization
A recent Innovation Webinar on Data Visualization explored how data visualization can be used to convey compelling evidence that influences behavior change and improves program performance by presenting data in ways that are both visually appealing and easy to understand. Examples of programs that have used data visualization as a communication tool were highlighted throughout the webinar and mentioned in an earlier post I wrote, Data Visualization: A Tool for Effective Health Communication.
In this post, I’d like to share even more resources from that webinar.
Amanda Makulec’s presentation on nurturing data visualization shared key insights into building data visualization skills and advocating for data visualization within your organization. Amanda, a Visual Analytics Advisory at John Snow Inc., works at the intersection of data analysis, visualization and storytelling, and is passionate about promoting the use of data for social good.
Improving Personal Skills
| Recommended Resources |
| FlowingData.com |
| thefunctionalart.com |
| PolicyViz.com |
| AnnKEmery.com |
| EvergreenData.com |
| StorytellingwithData.com |
Building your own skills begins by learning from experts. There are many resources available to help build data visualization skills, including both resources for inspiration and for instruction.
As you build your skills, Amanda continued, it’s important to analyze examples and think about what works (and what doesn’t!) and find opportunities to practice your design skills. Joining communities where you can connect with other data visualization enthusiasts is a great way to improve your skills and learn perspectives from experts working in different areas of information design. Communities such as Data Analysts for Social Good, Data Viz Hub and the American Evaluation Association can be key resources to talk about and share resources on how to translate data tables into intriguing, useful visualizations.
Adding Organizational Value
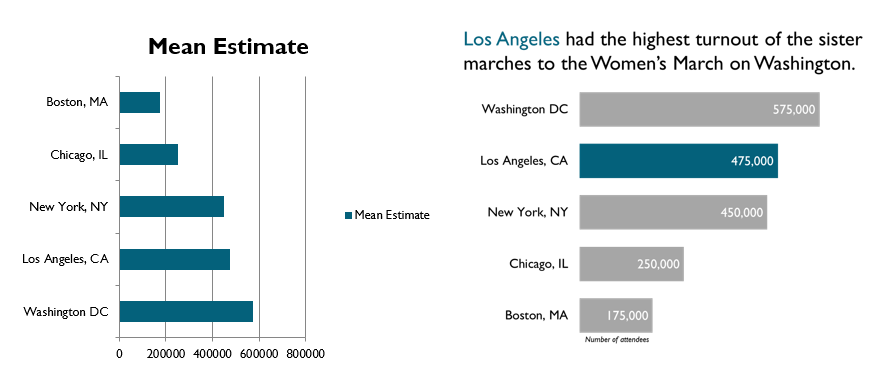
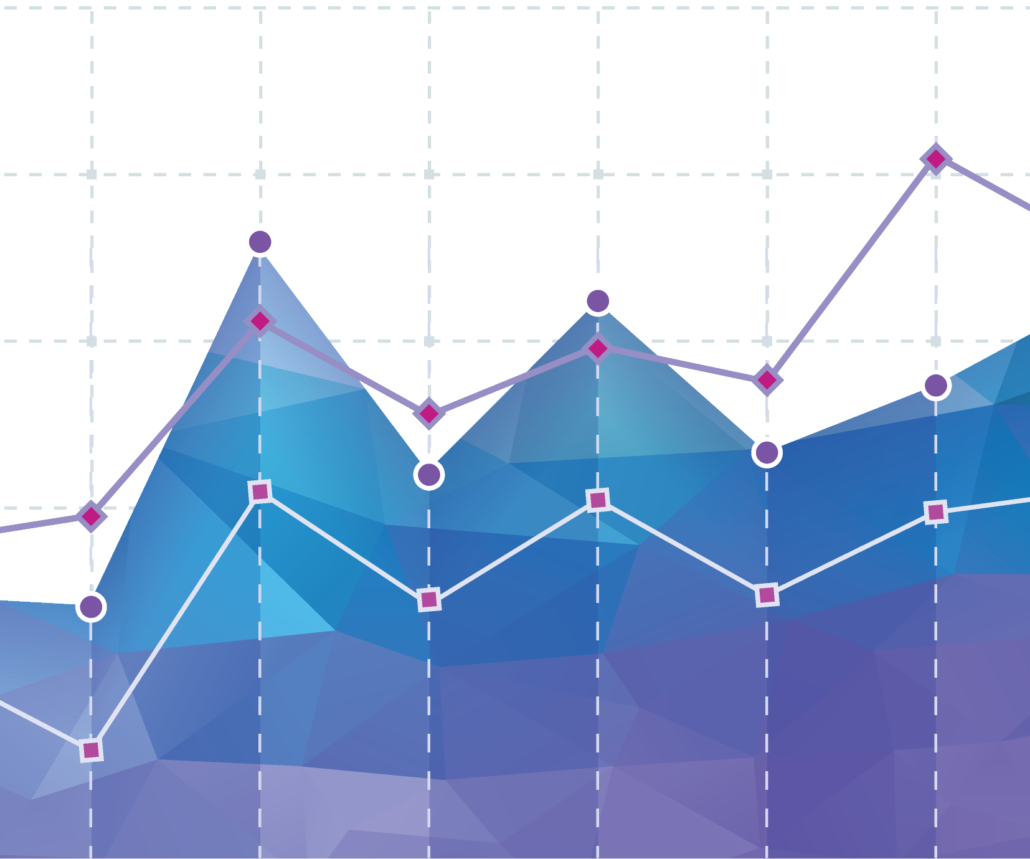
“Show rather than tell,” Amanda Makulec said. Which visualization is more powerful?
Advocating for and creating change where you work takes time, but there are many steps to take to add value to your organization. Amanda noted the importance of using data visualization techniques and showing how they improve effectiveness of data visualization to prove your case when advocating within your organization.
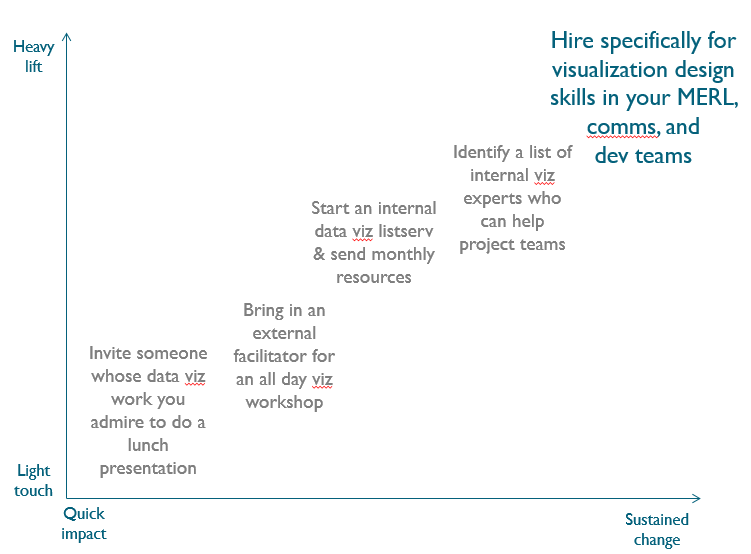
Building from quick impact activities to sustained change.
Mobilizing your internal network and nurturing your data visualization champions can help you best accomplish effective data visualization through multi-disciplinary teams with different perspectives on information design. While sustained change takes time, you can start with light touch and quick impact efforts, such as inviting someone whose data visualization work you admire to do a lunch presentation. You can then build up to hiring for data visualization design skills for sustained change as you develop greater recognition and concurrence from leadership.
Successful Data Visualization Collaboration
Improved personal skills and organizational development can be used for successful data visualization collaboration. Amanda’s tips for success include:
- Speak the same language. Data visualization encompasses a lot of things, so you must make sure you know what your team is trying to create.
- Ask lots of questions. Think about who is consuming info, what they want to know and how they will use info – and do this at the beginning of the project!
- Understand the audience. Focus on the human side of data visualization, not just titles or roles.
- Sketch first. Save yourself time and give yourself a rough proof of concept before beginning.
- Be realistic with deadlines. Especially in the beginning, it takes time to master data visualization and create something wonderful!


Leave a Reply
Want to join the discussion?Feel free to contribute!